Workshop Experience: Web Scraper on BBC iPlayer
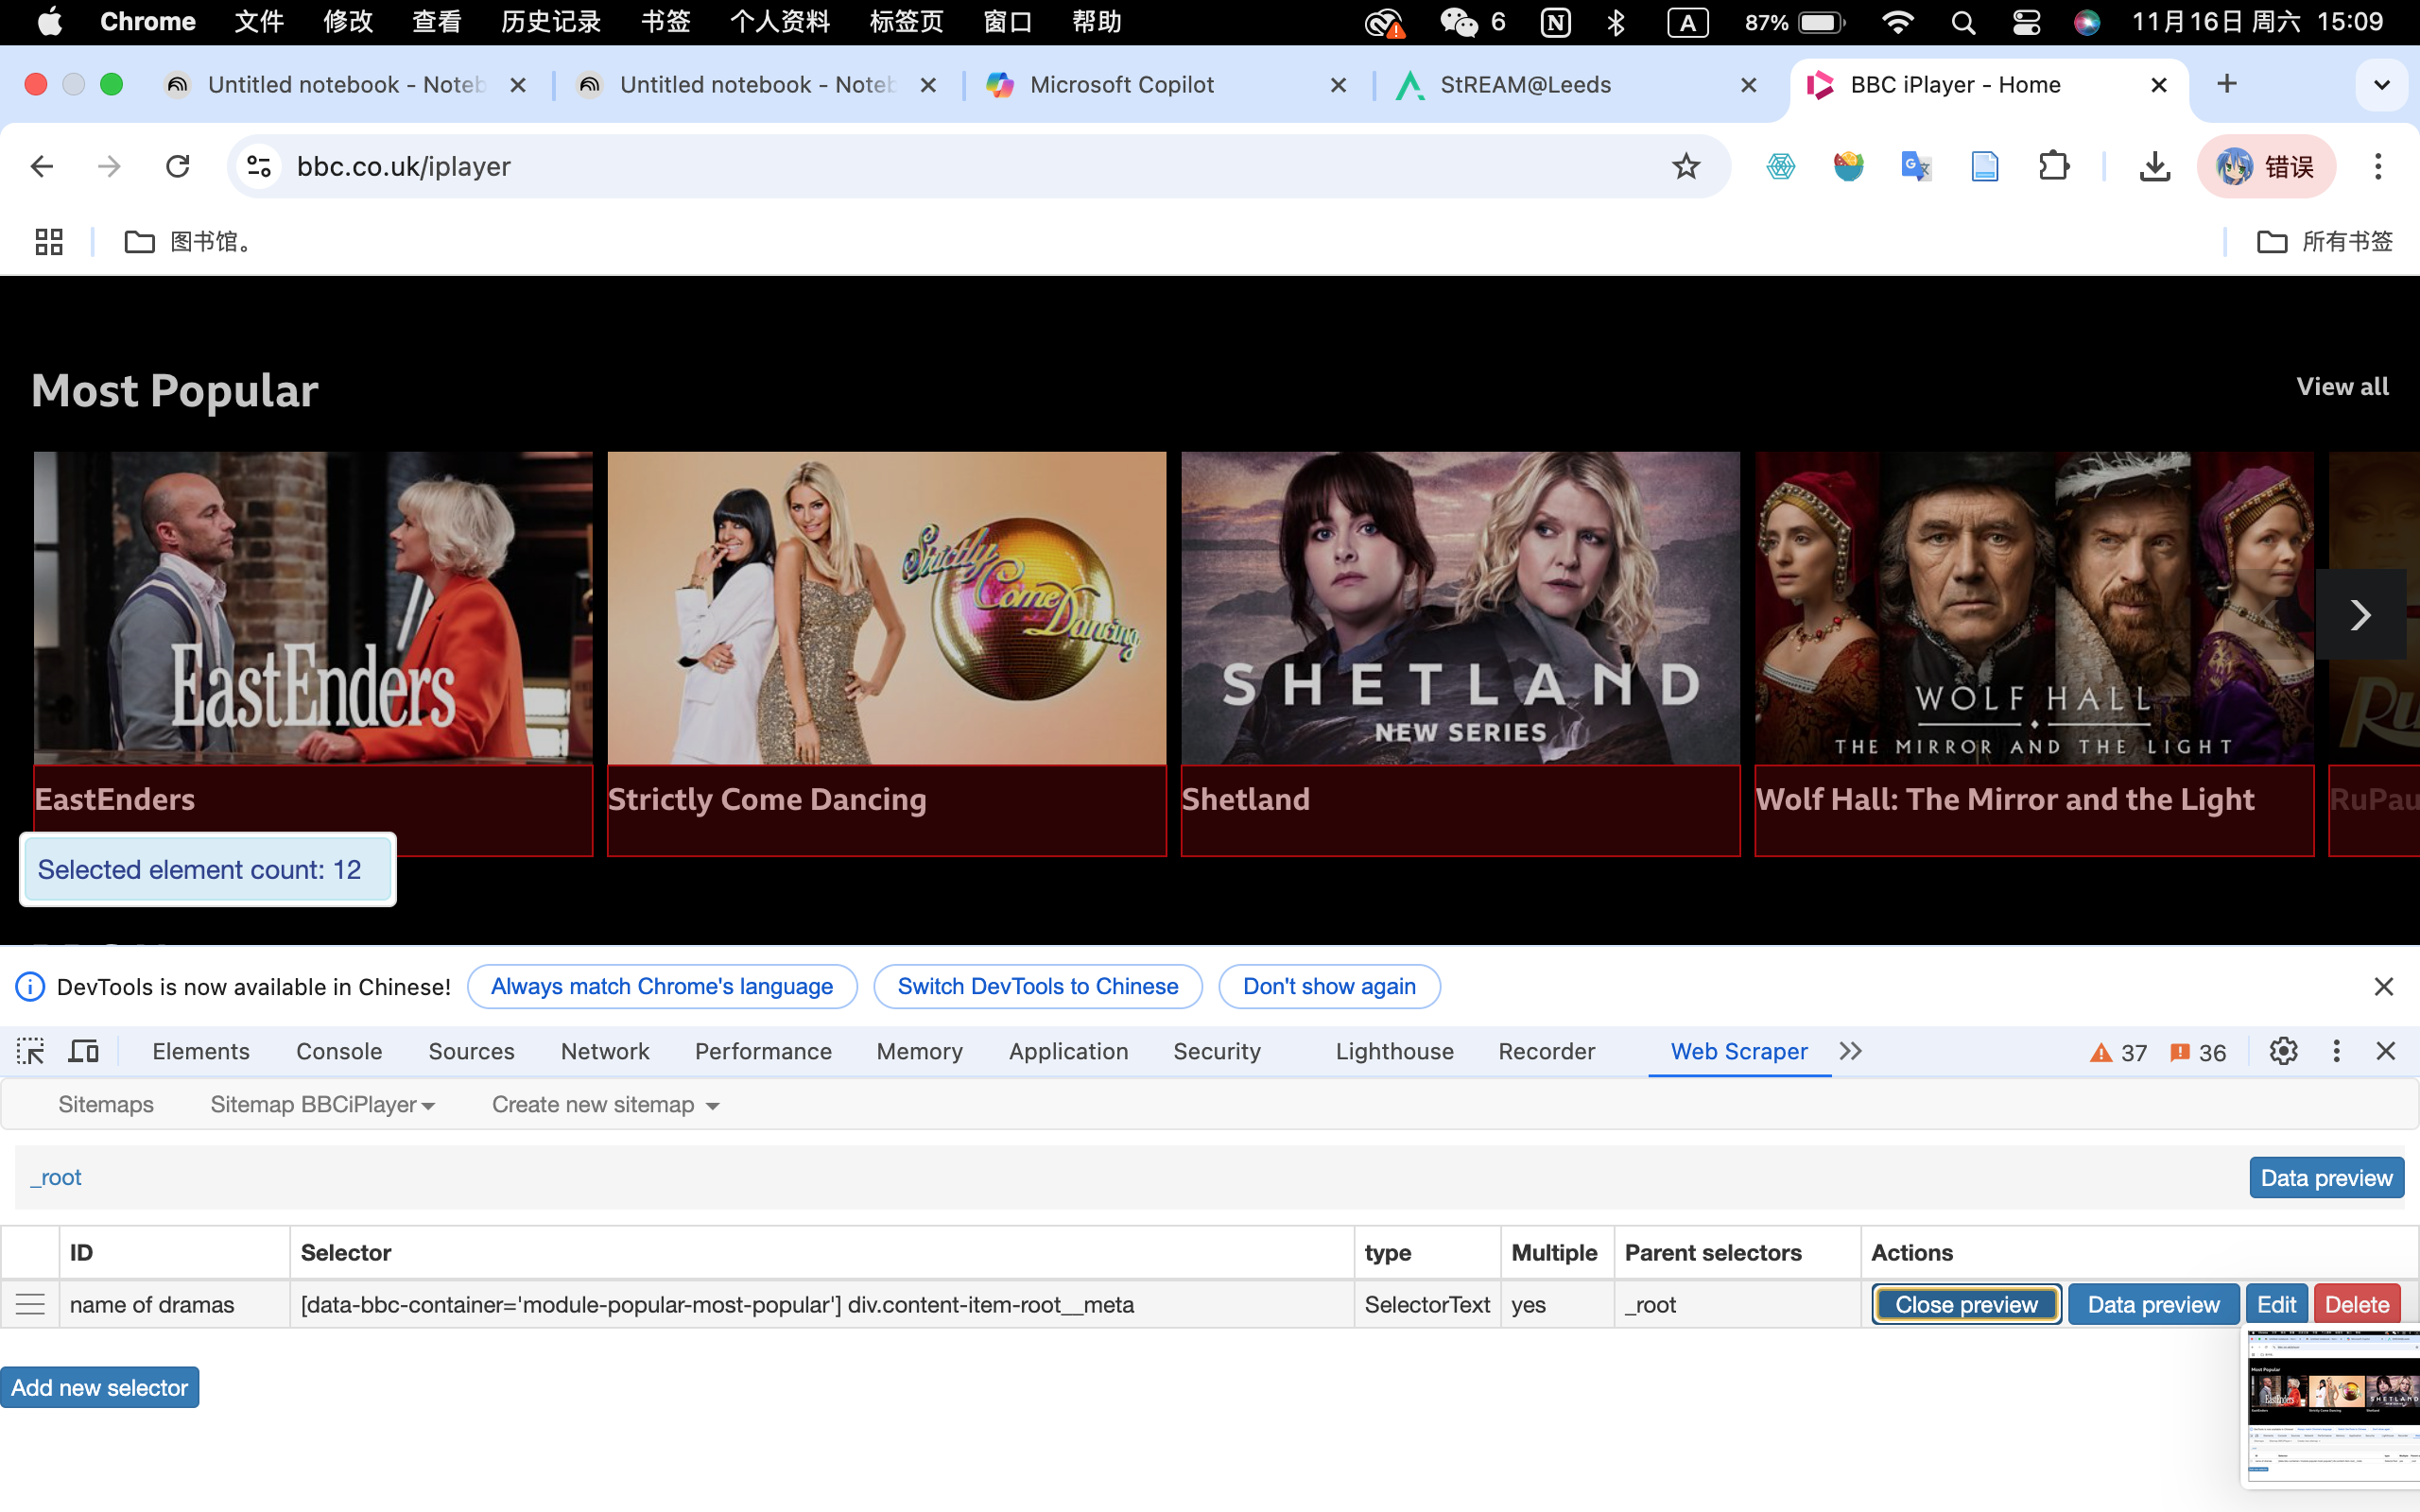
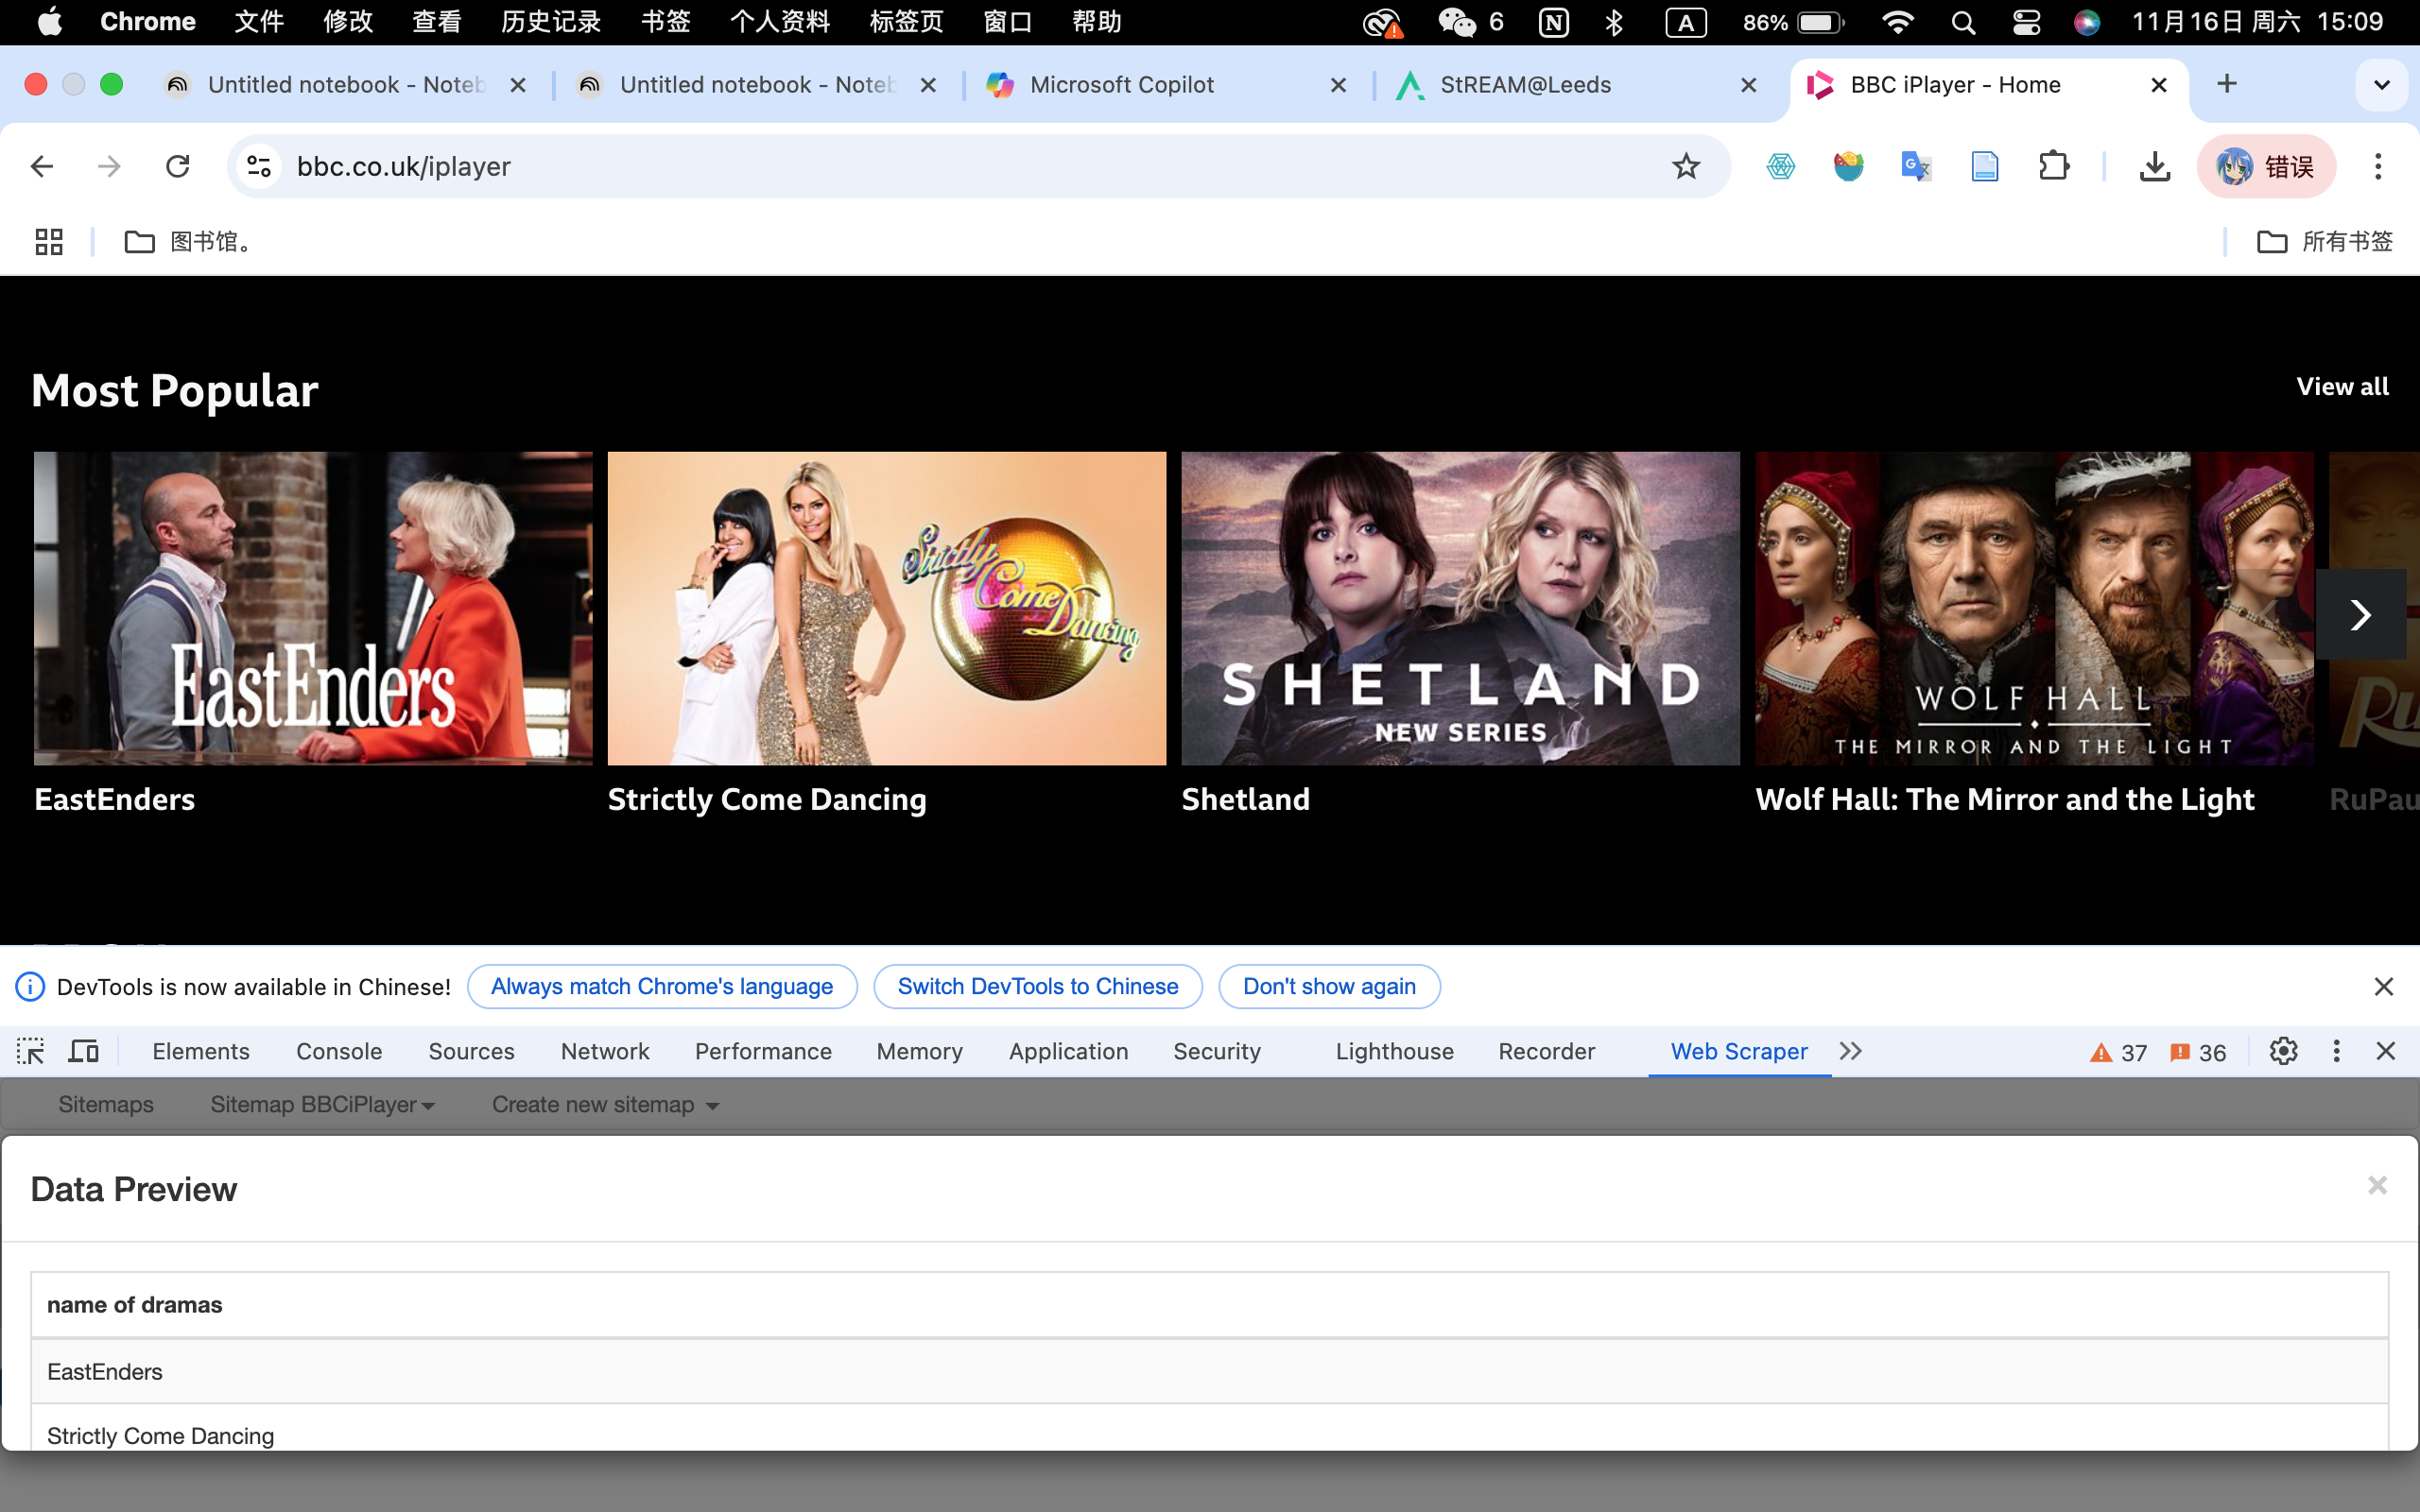
During this workshop, the instructor introduced Web Scraper as a tool for collecting data, so I decided to give it a try on the BBC iPlayer homepage. The Chrome extension was surprisingly easy to use, and I was able to extract the names of popular dramas from the website without any issues. This was a great starting point to see how web scraping works in practice, and it highlighted how efficient it can be for gathering structured data from public websites.
However, when I tried to apply the same tool to the Stream@Leeds website, things didn’t go as smoothly. I found it challenging to scrape specific text or tables accurately, which might be due to a few reasons. One possibility is that the tool struggled with the way the content is structured on the site, especially if it involves dynamically loaded elements or nested formats. Another potential issue could be that the university website has anti-scraping measures in place to prevent automated tools from extracting data.
Reflection: Challenges and Ethical Considerations
This experience taught me two things. First, while tools like Web Scraper are powerful and user-friendly, they have limitations, especially when dealing with more complex or protected websites. Second, for sites like Stream@Leeds, I may need to explore more advanced tools like Python’s Selenium, which can mimic human interactions and potentially bypass these challenges. Alternatively, reaching out to the university’s IT team to check if there’s an API or an official method for accessing this data could be a more efficient and ethical solution.
Overall, this exercise was a valuable learning experience, as it not only showed me the potential of web scraping but also exposed me to its limitations and the ethical considerations that come with it.
Engagement Metrics on Stream@Leeds
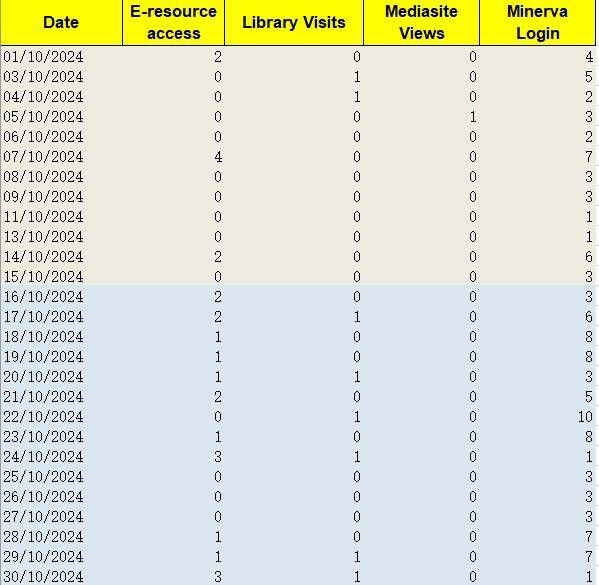
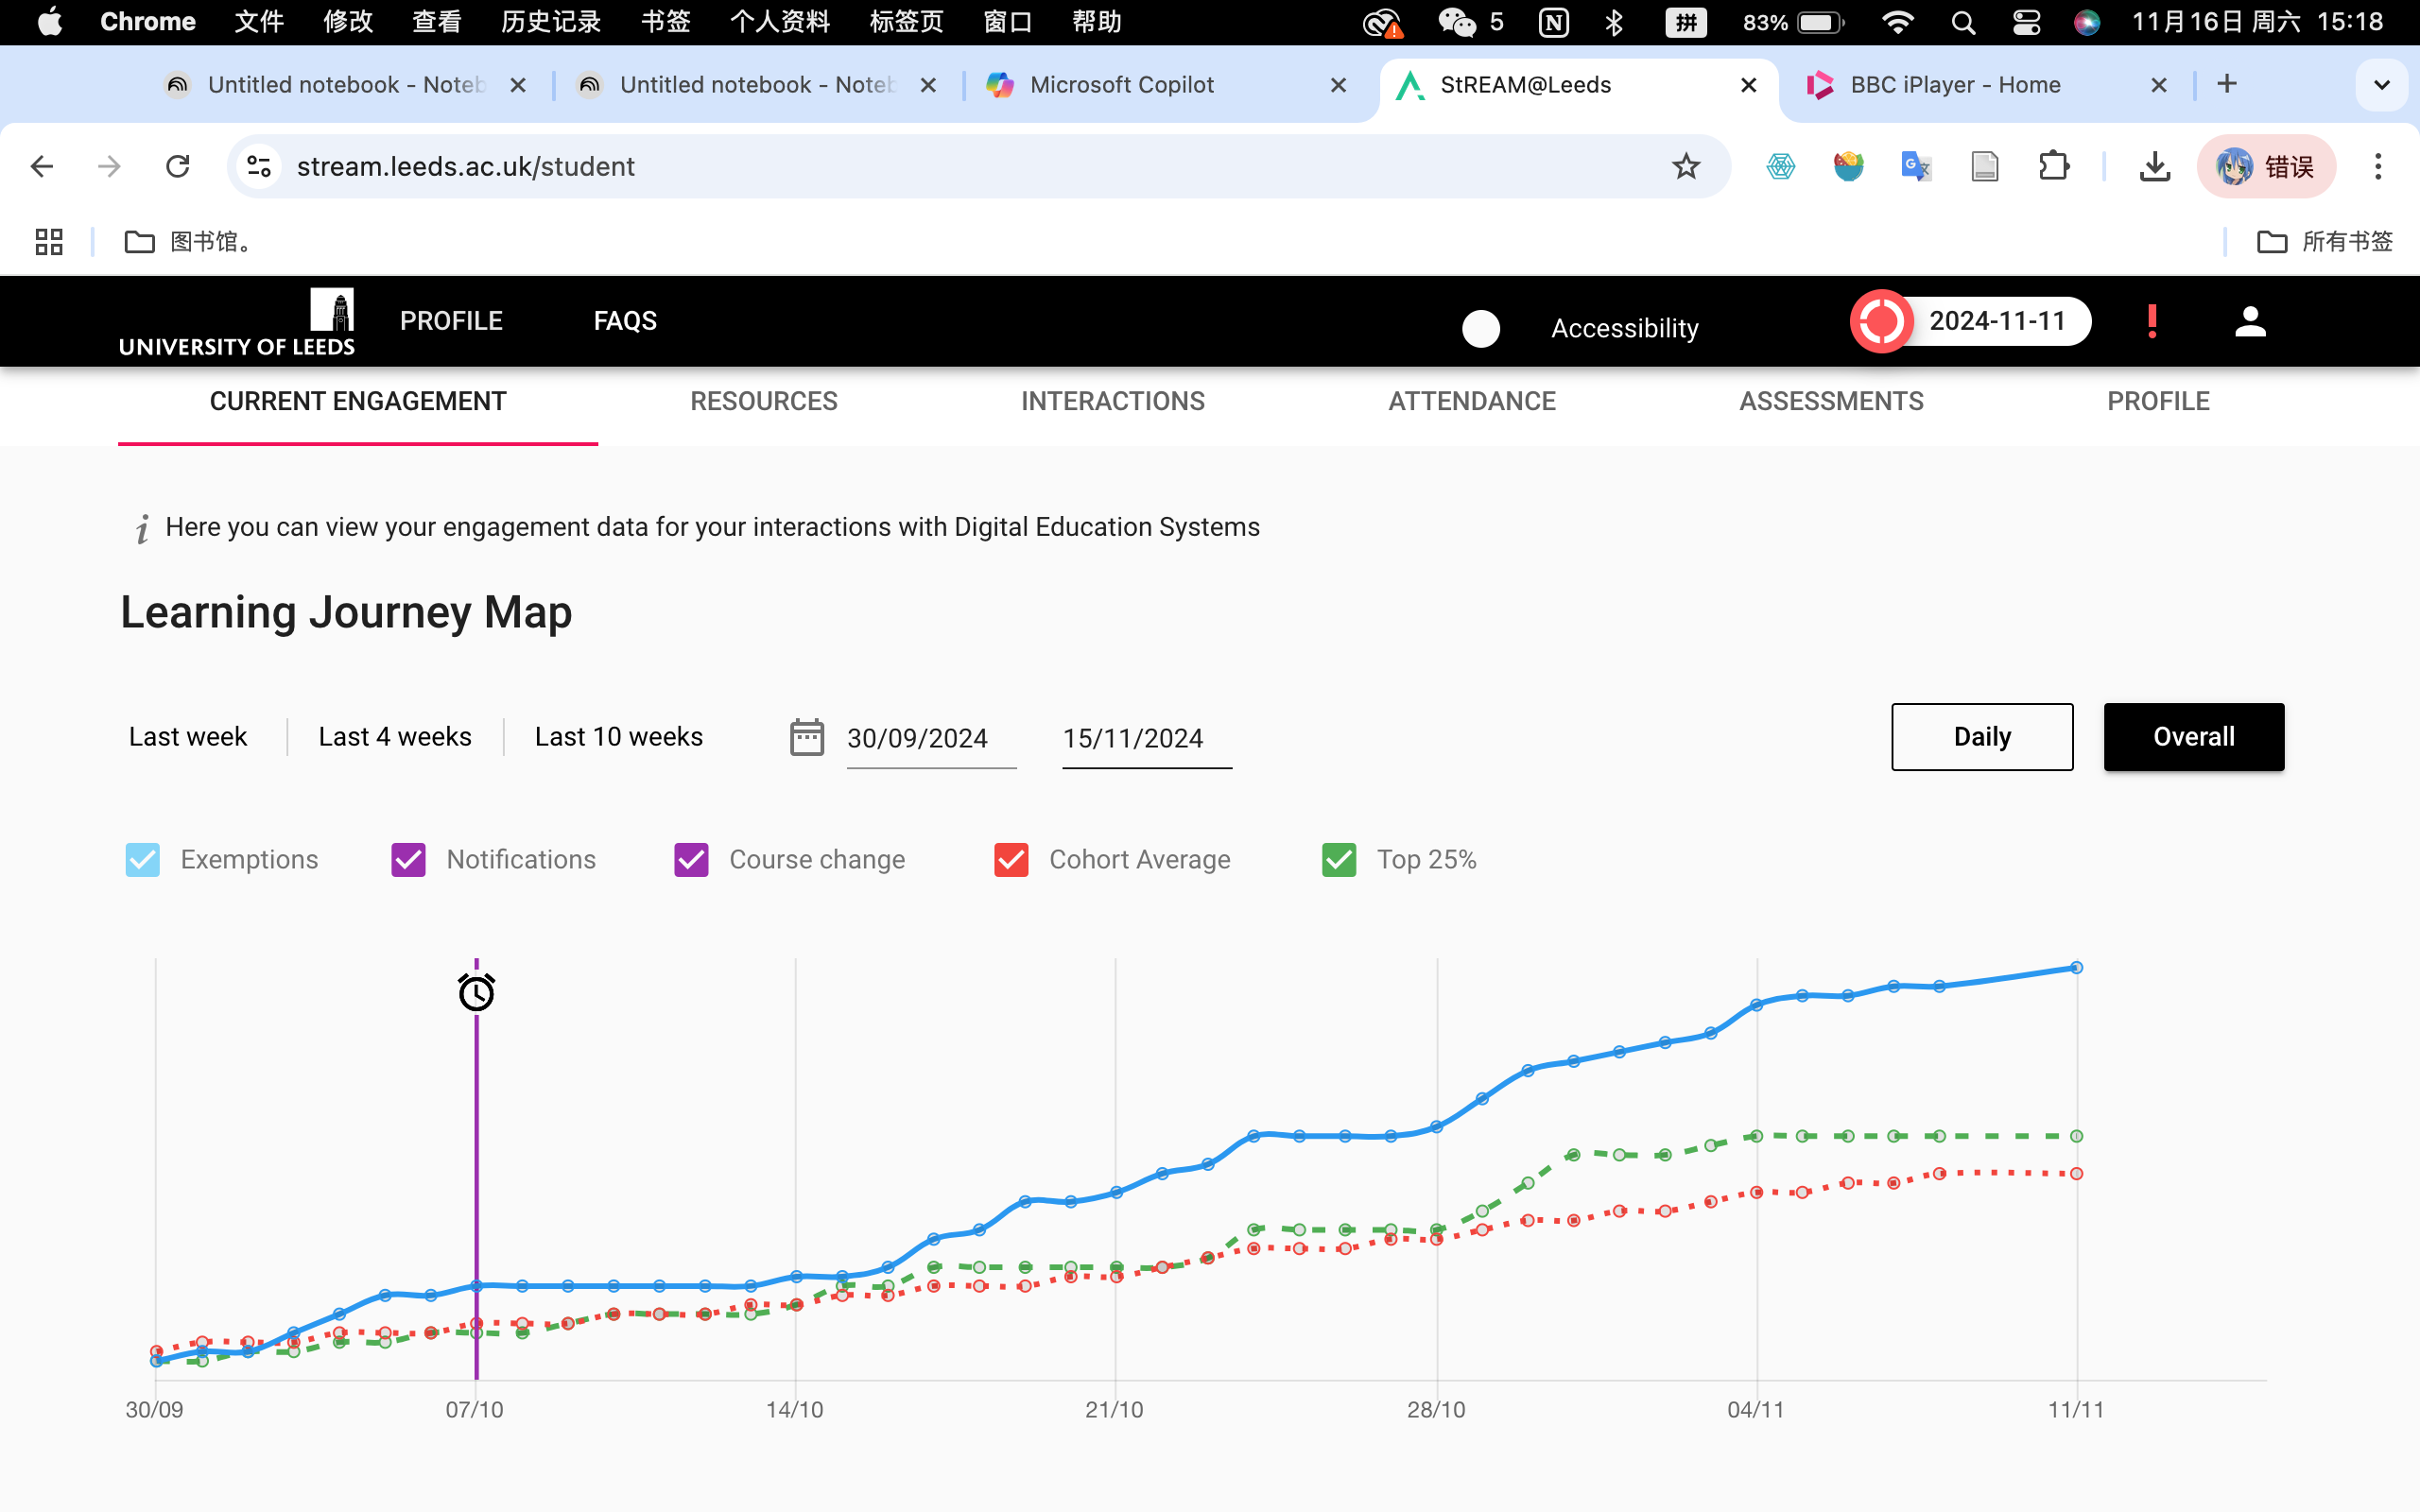
When I looked at my Stream@Leeds, I noticed that it provided a detailed timeline of various metrics such as exemptions, notifications, course changes, cohort averages, and whether I’m in the top 25% of engagement. While this visualization is helpful, it raised some questions for me about how this data is collected and classified. For example, what specific actions are being counted as “engagement”? Are they focusing only on digital interactions, like logins or resource clicks, or do they also account for less measurable forms of learning, such as offline study?
Moreover, the representation of engagement through simplified metrics might miss the nuances of how students interact with learning materials. The hierarchical organization (e.g., grouping students into cohort averages or top 25%) and the potential use of binary classifications (e.g., engaged vs. not engaged) might oversimplify the diverse ways students participate in their learning journeys. For instance, a student who prefers watching recorded lectures might appear less engaged than one who attends live sessions, even if they’re equally committed to learning.